When I started this blog, I decided to learn the fundamentals needed for computer graphics and physics engines. That path led me to learn and write about
derivatives
, calculus, and related topics. I wanted to represent derivatives visually, but I could not find a library in the D3.js community that did this. I first wrote an inline D3.js script and then realized I could build an API around it. function-plot grew out of that experiment.
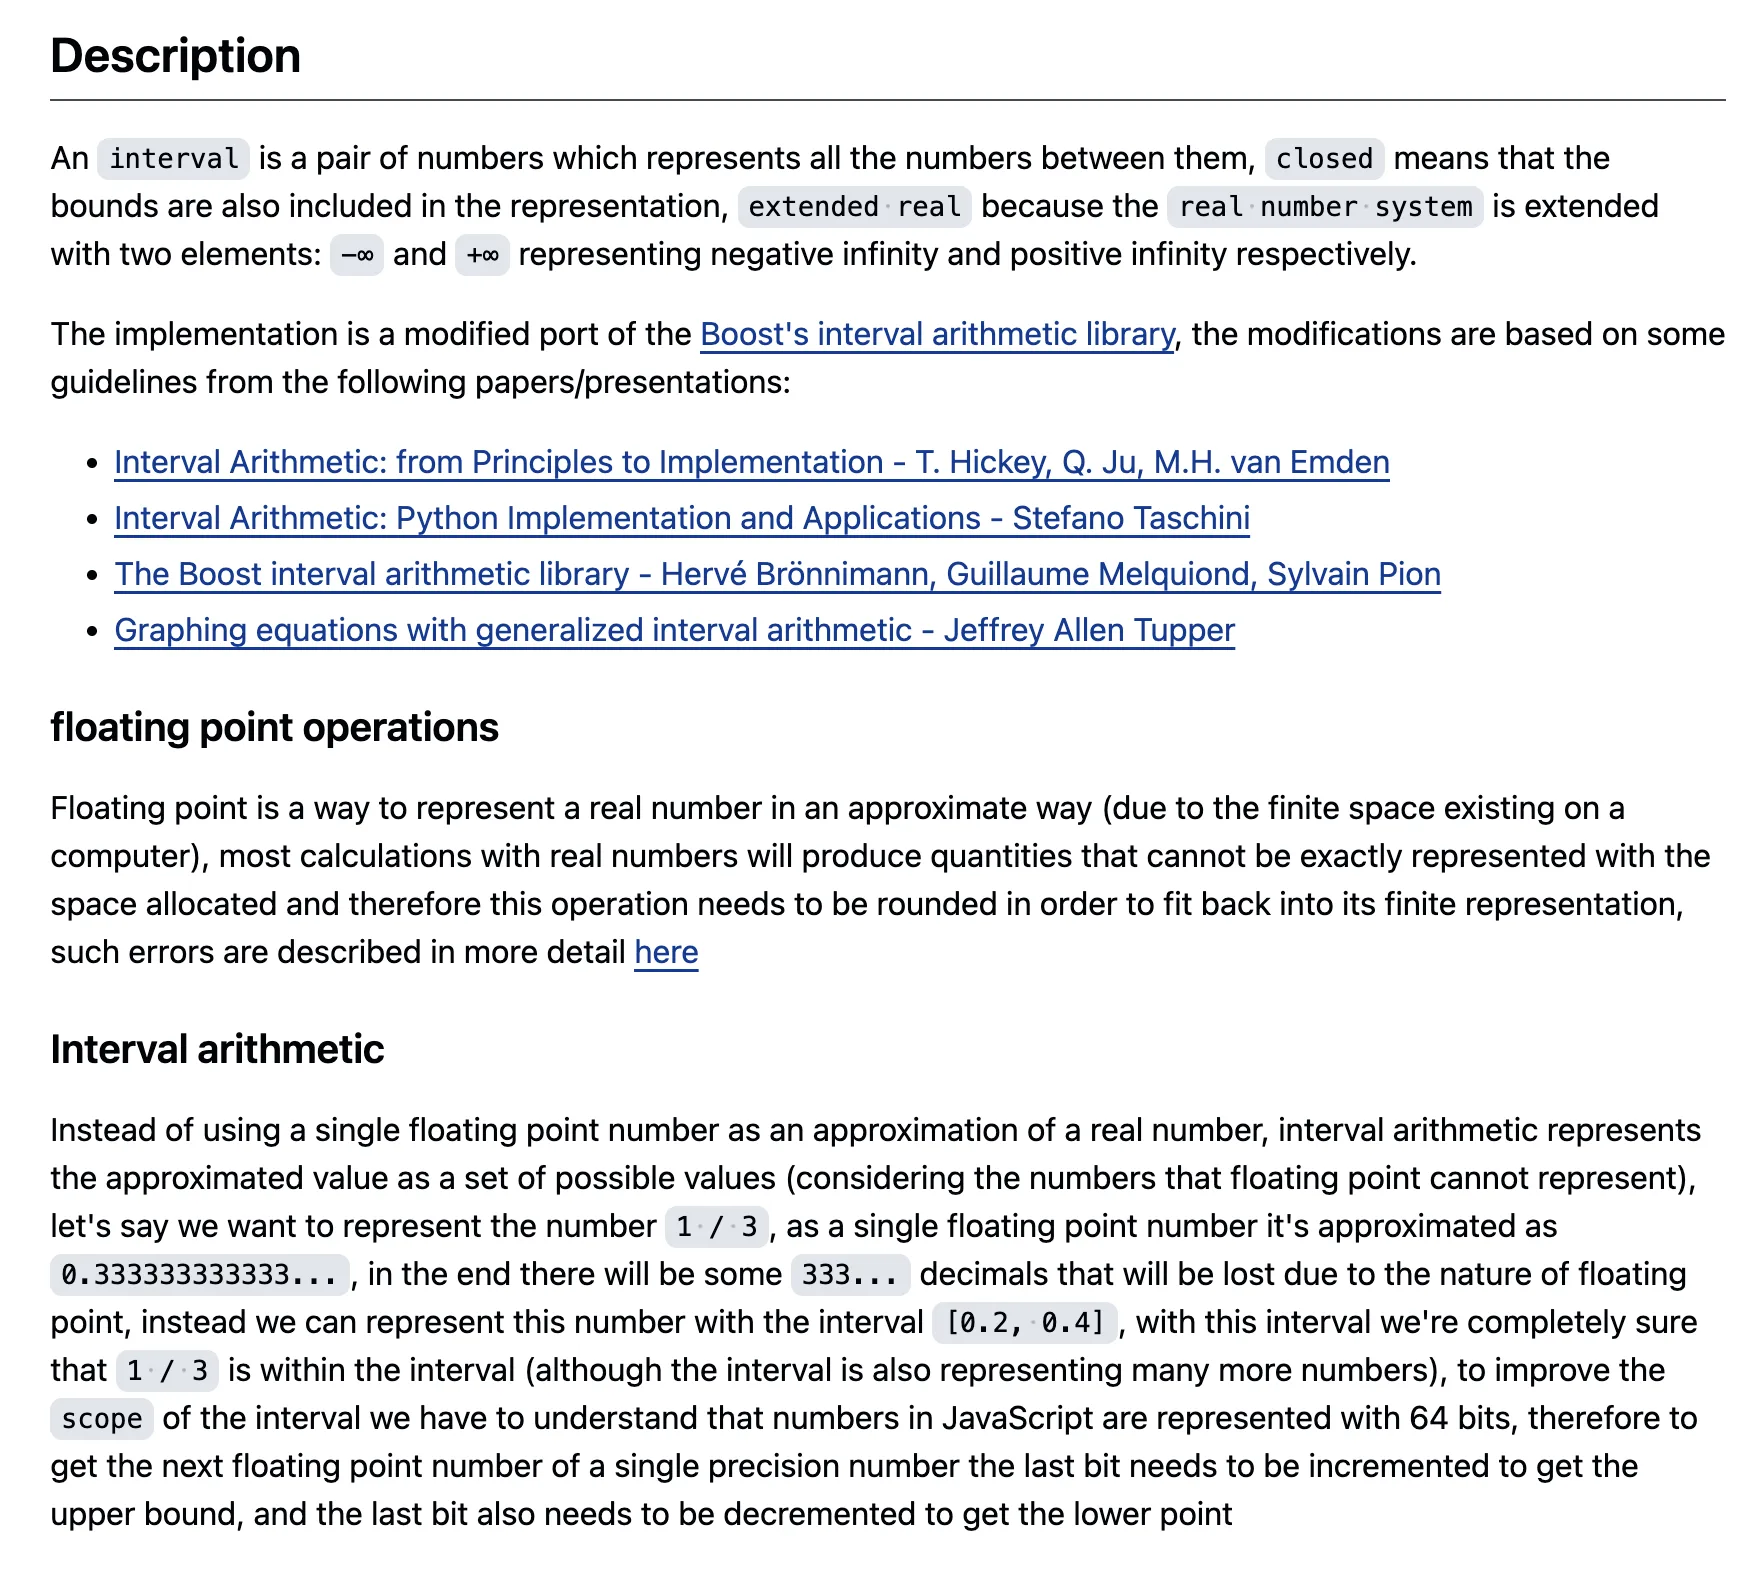
This became one of the most complex projects I have worked on. A 2D plotter looks like a function sampler, but handling asymptotes and rapidly oscillating functions requires much more. I learned that plotting correctly is tied to how computers represent numbers and lose precision in values such as 1/3. That led me to write
interval-arithmetic
, which works with intervals instead of individual numbers. I then wrote a parser from scratch to turn expressions such as
x^2+x-3 into executable JavaScript using interval arithmetic.
I am still working on function-plot more than ten years later, and it continues to evolve with new features. The project has also brought me opportunities to meet one of the early employees of
Figma
and visit their offices, and to connect with the author of
GeoGebra
, one of the leading products for teaching mathematics.